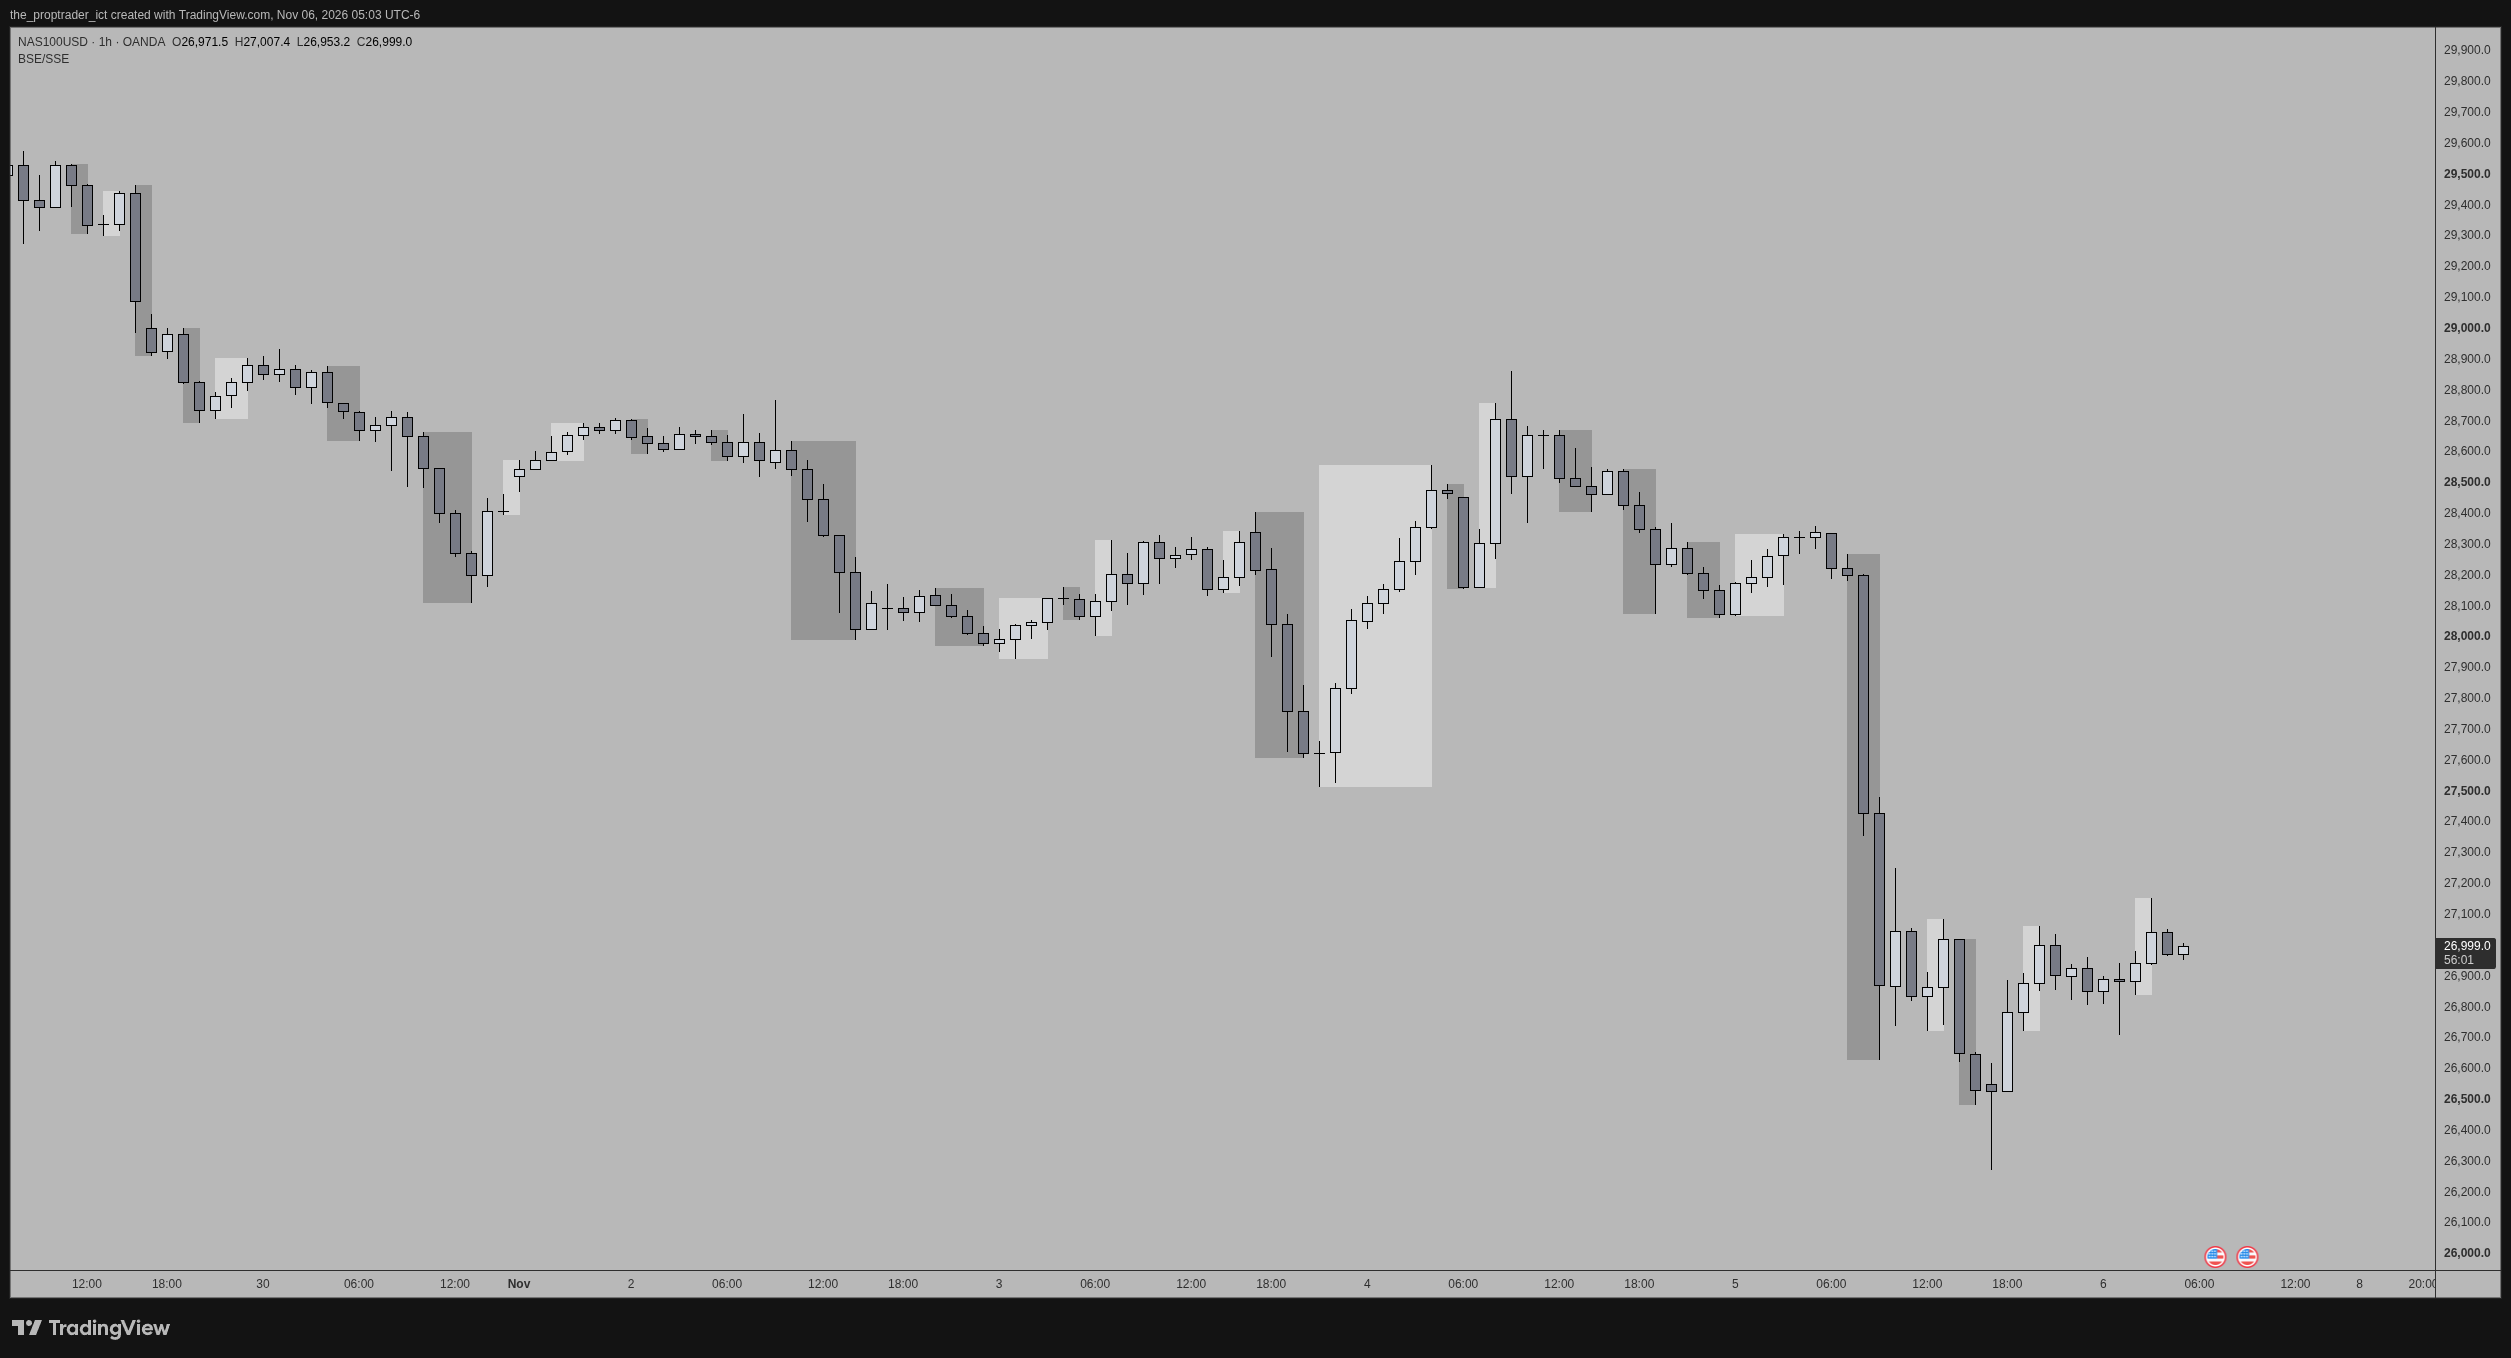
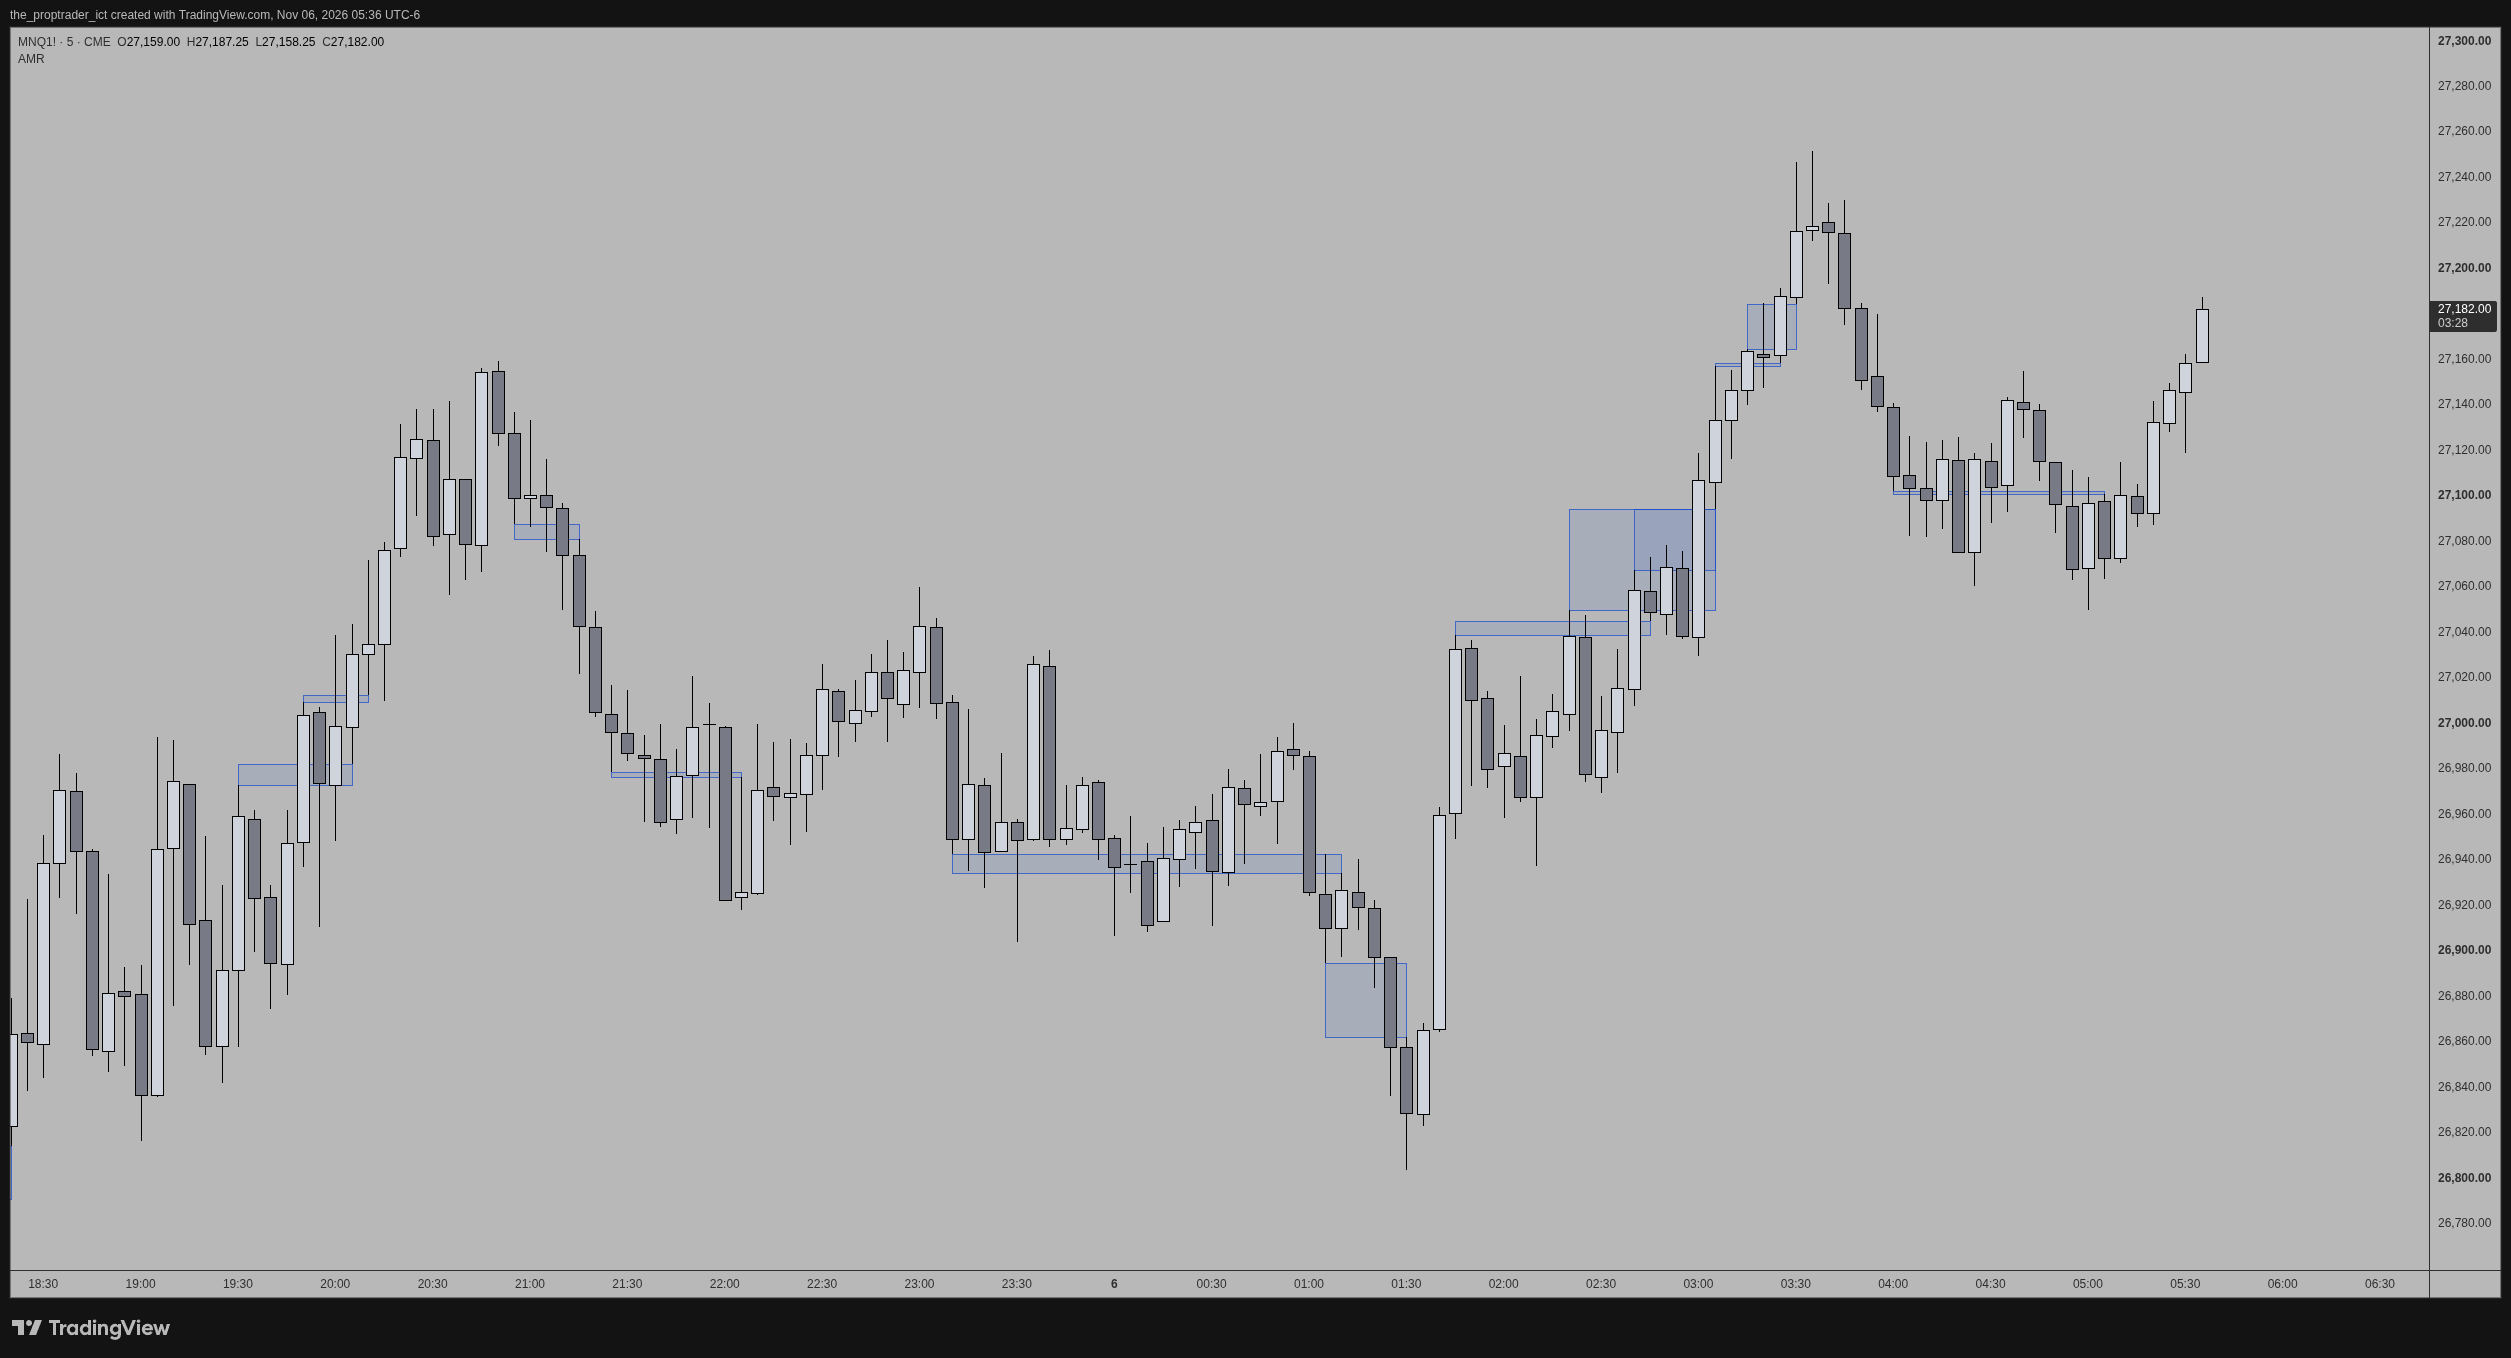
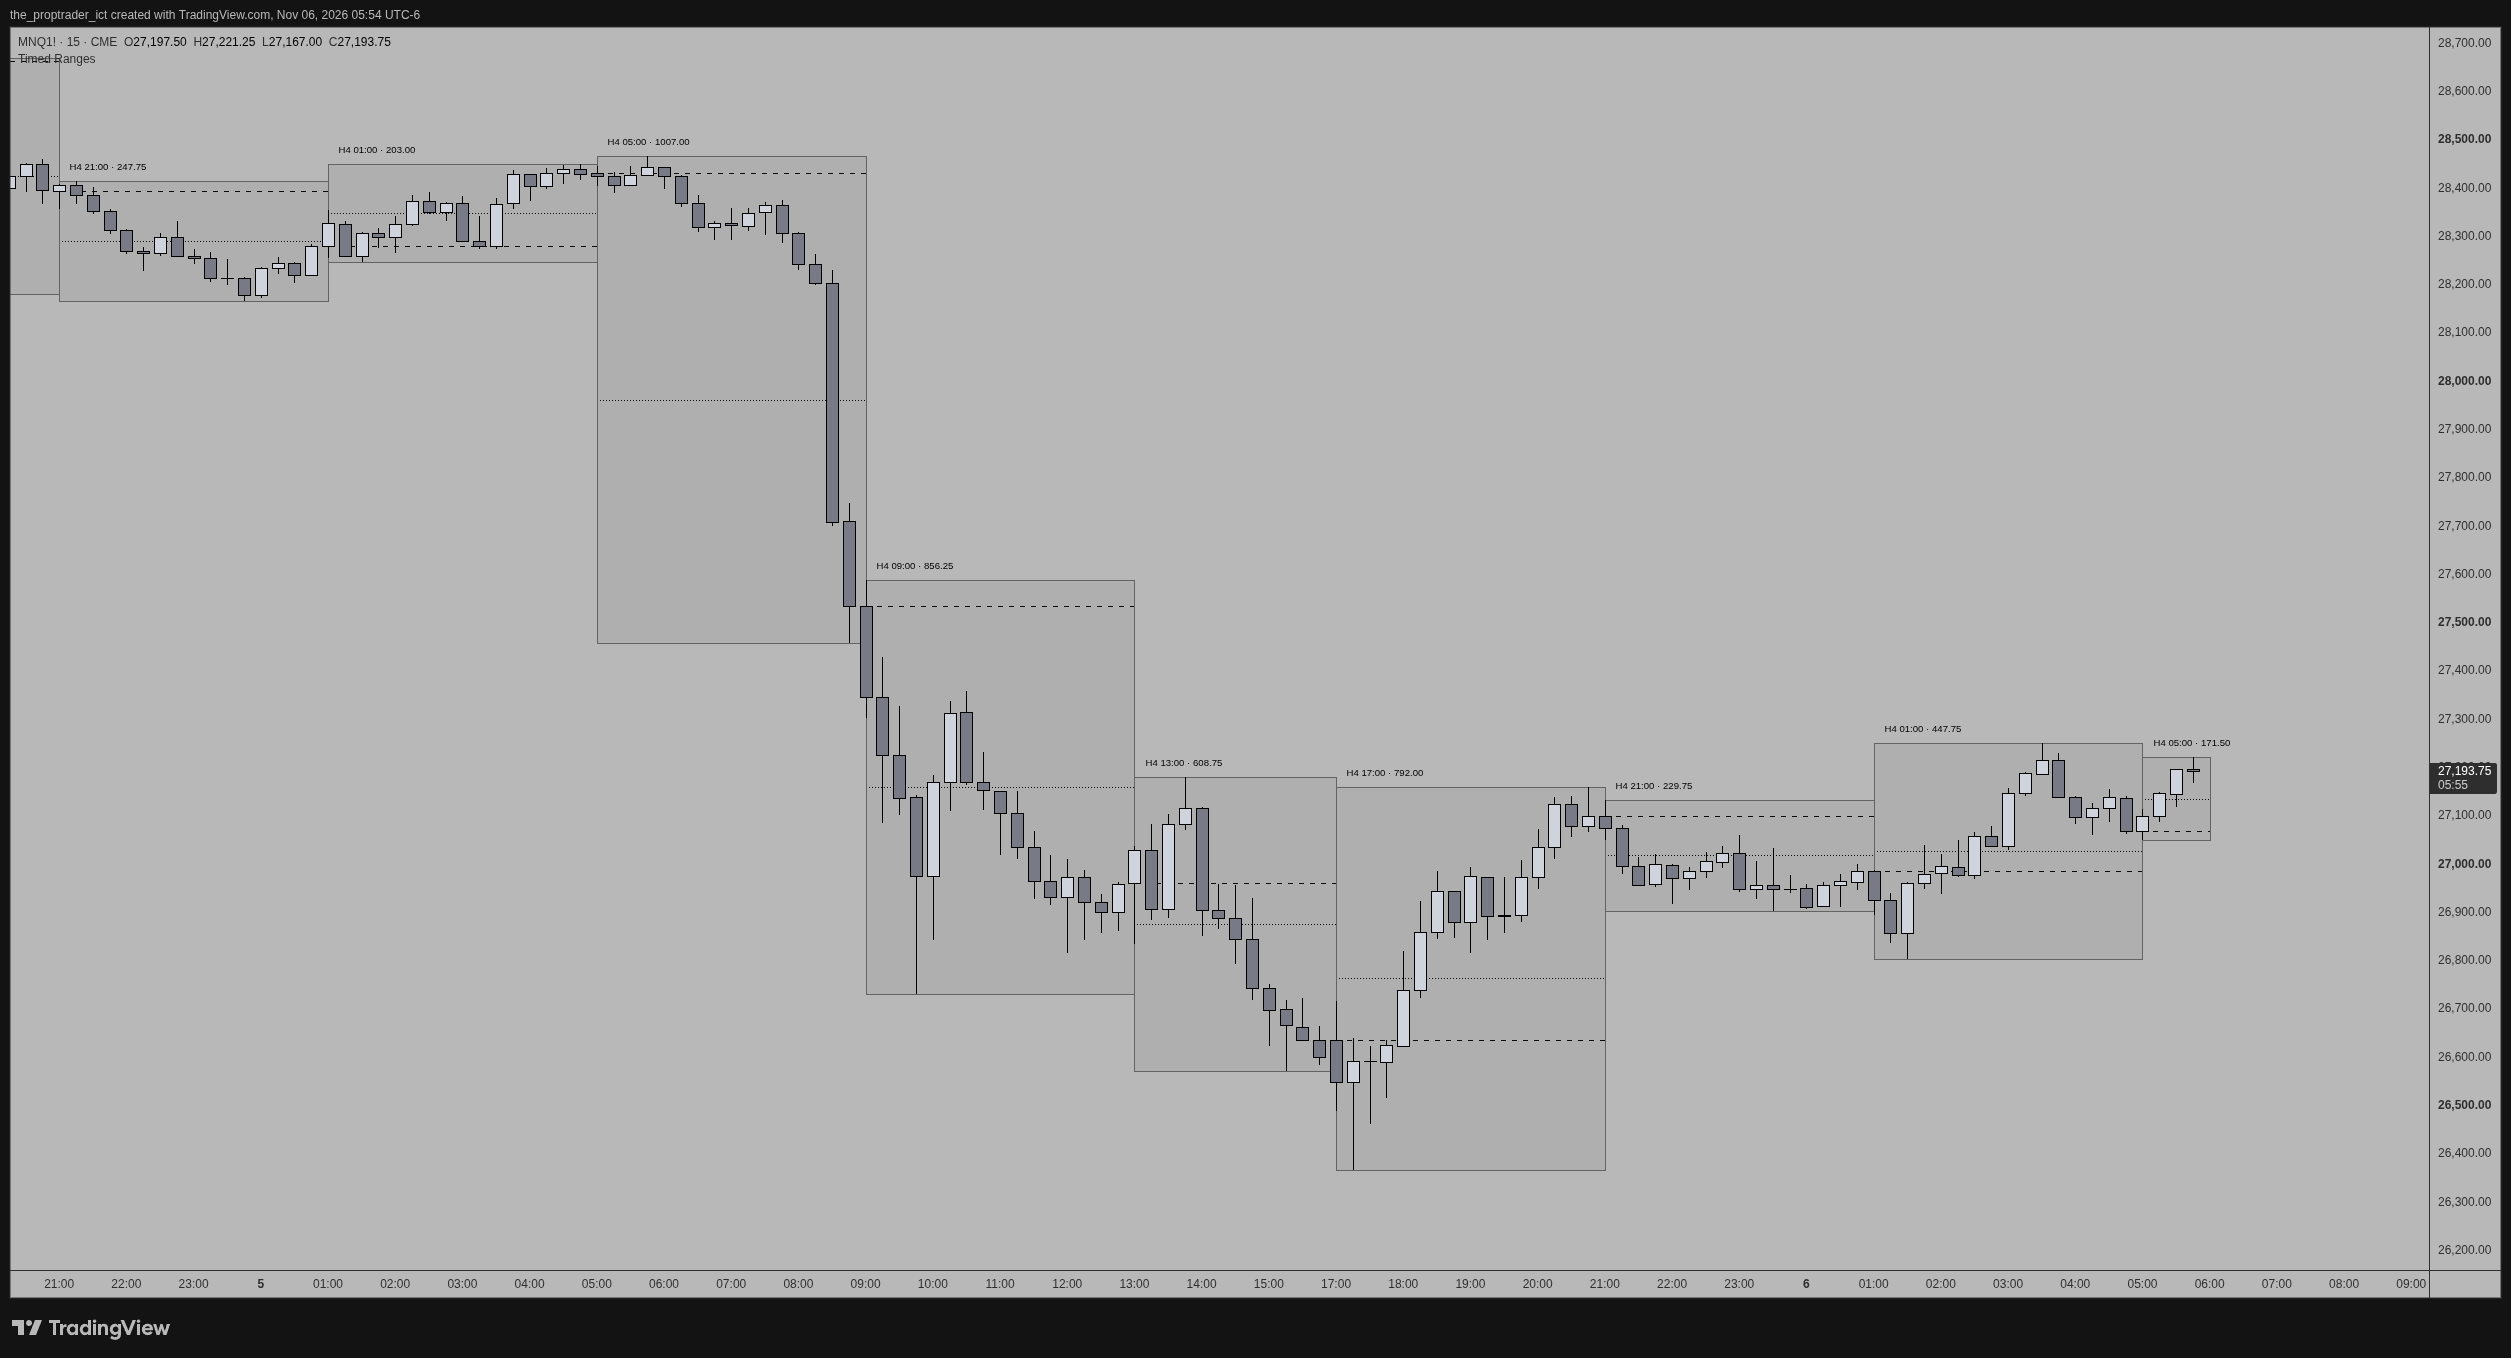
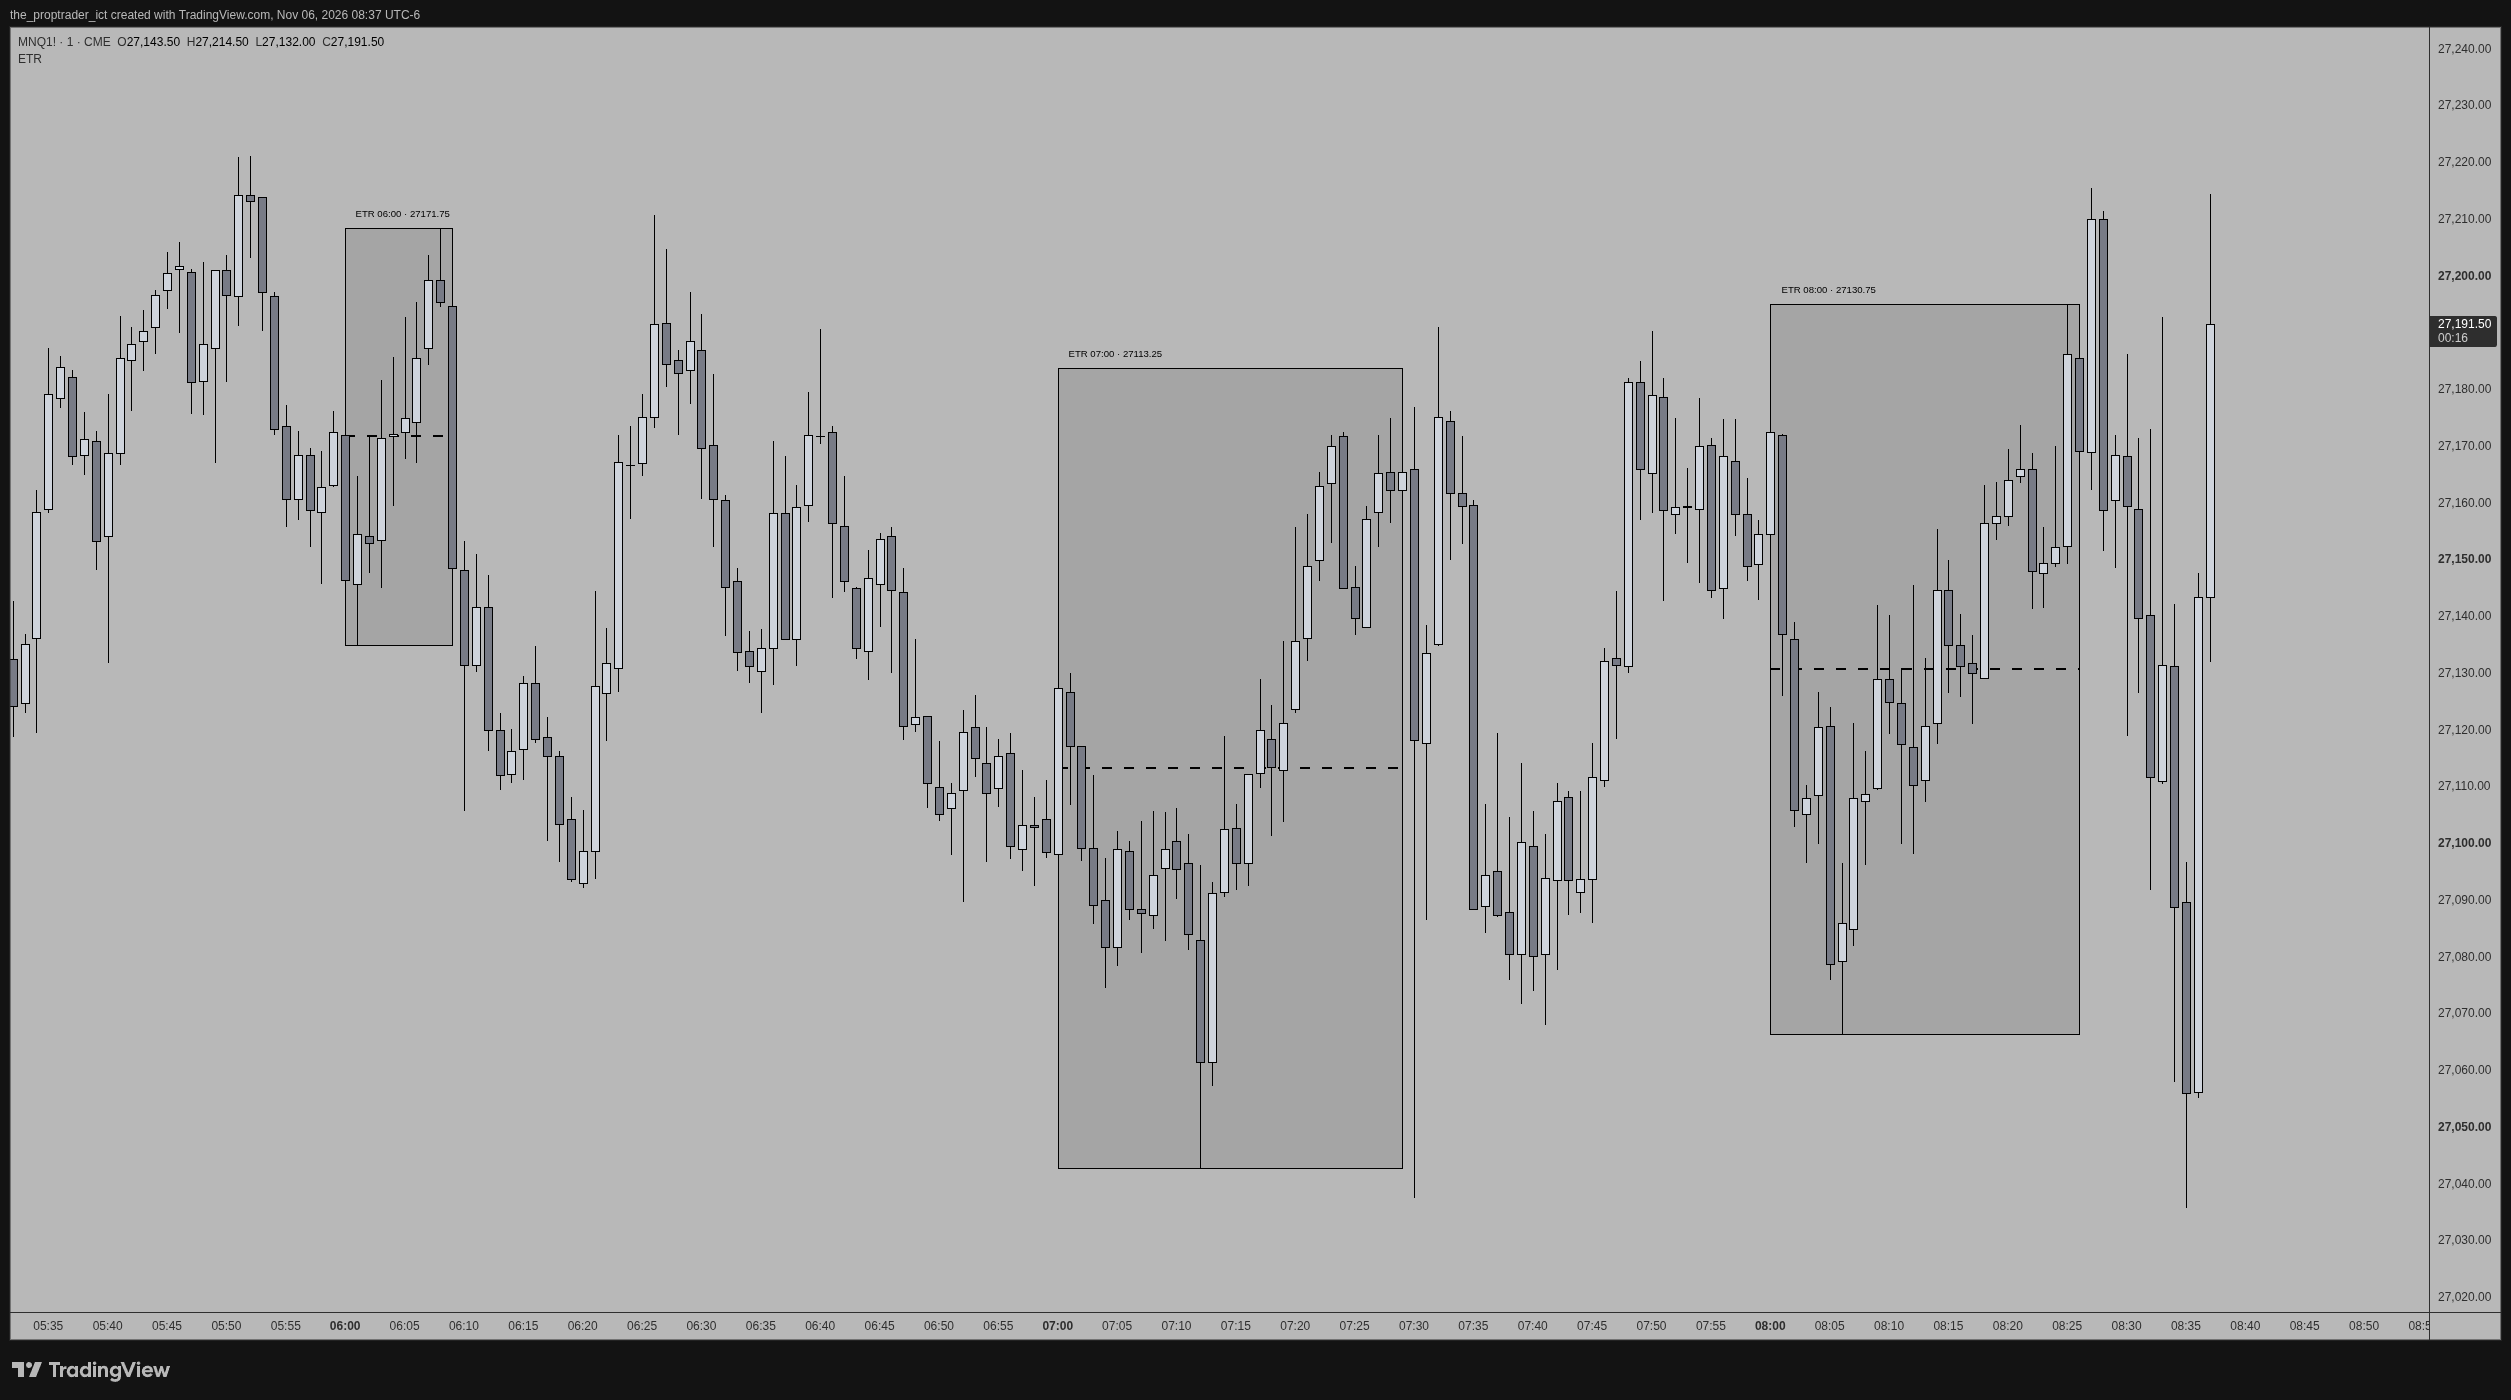
HTF Candles
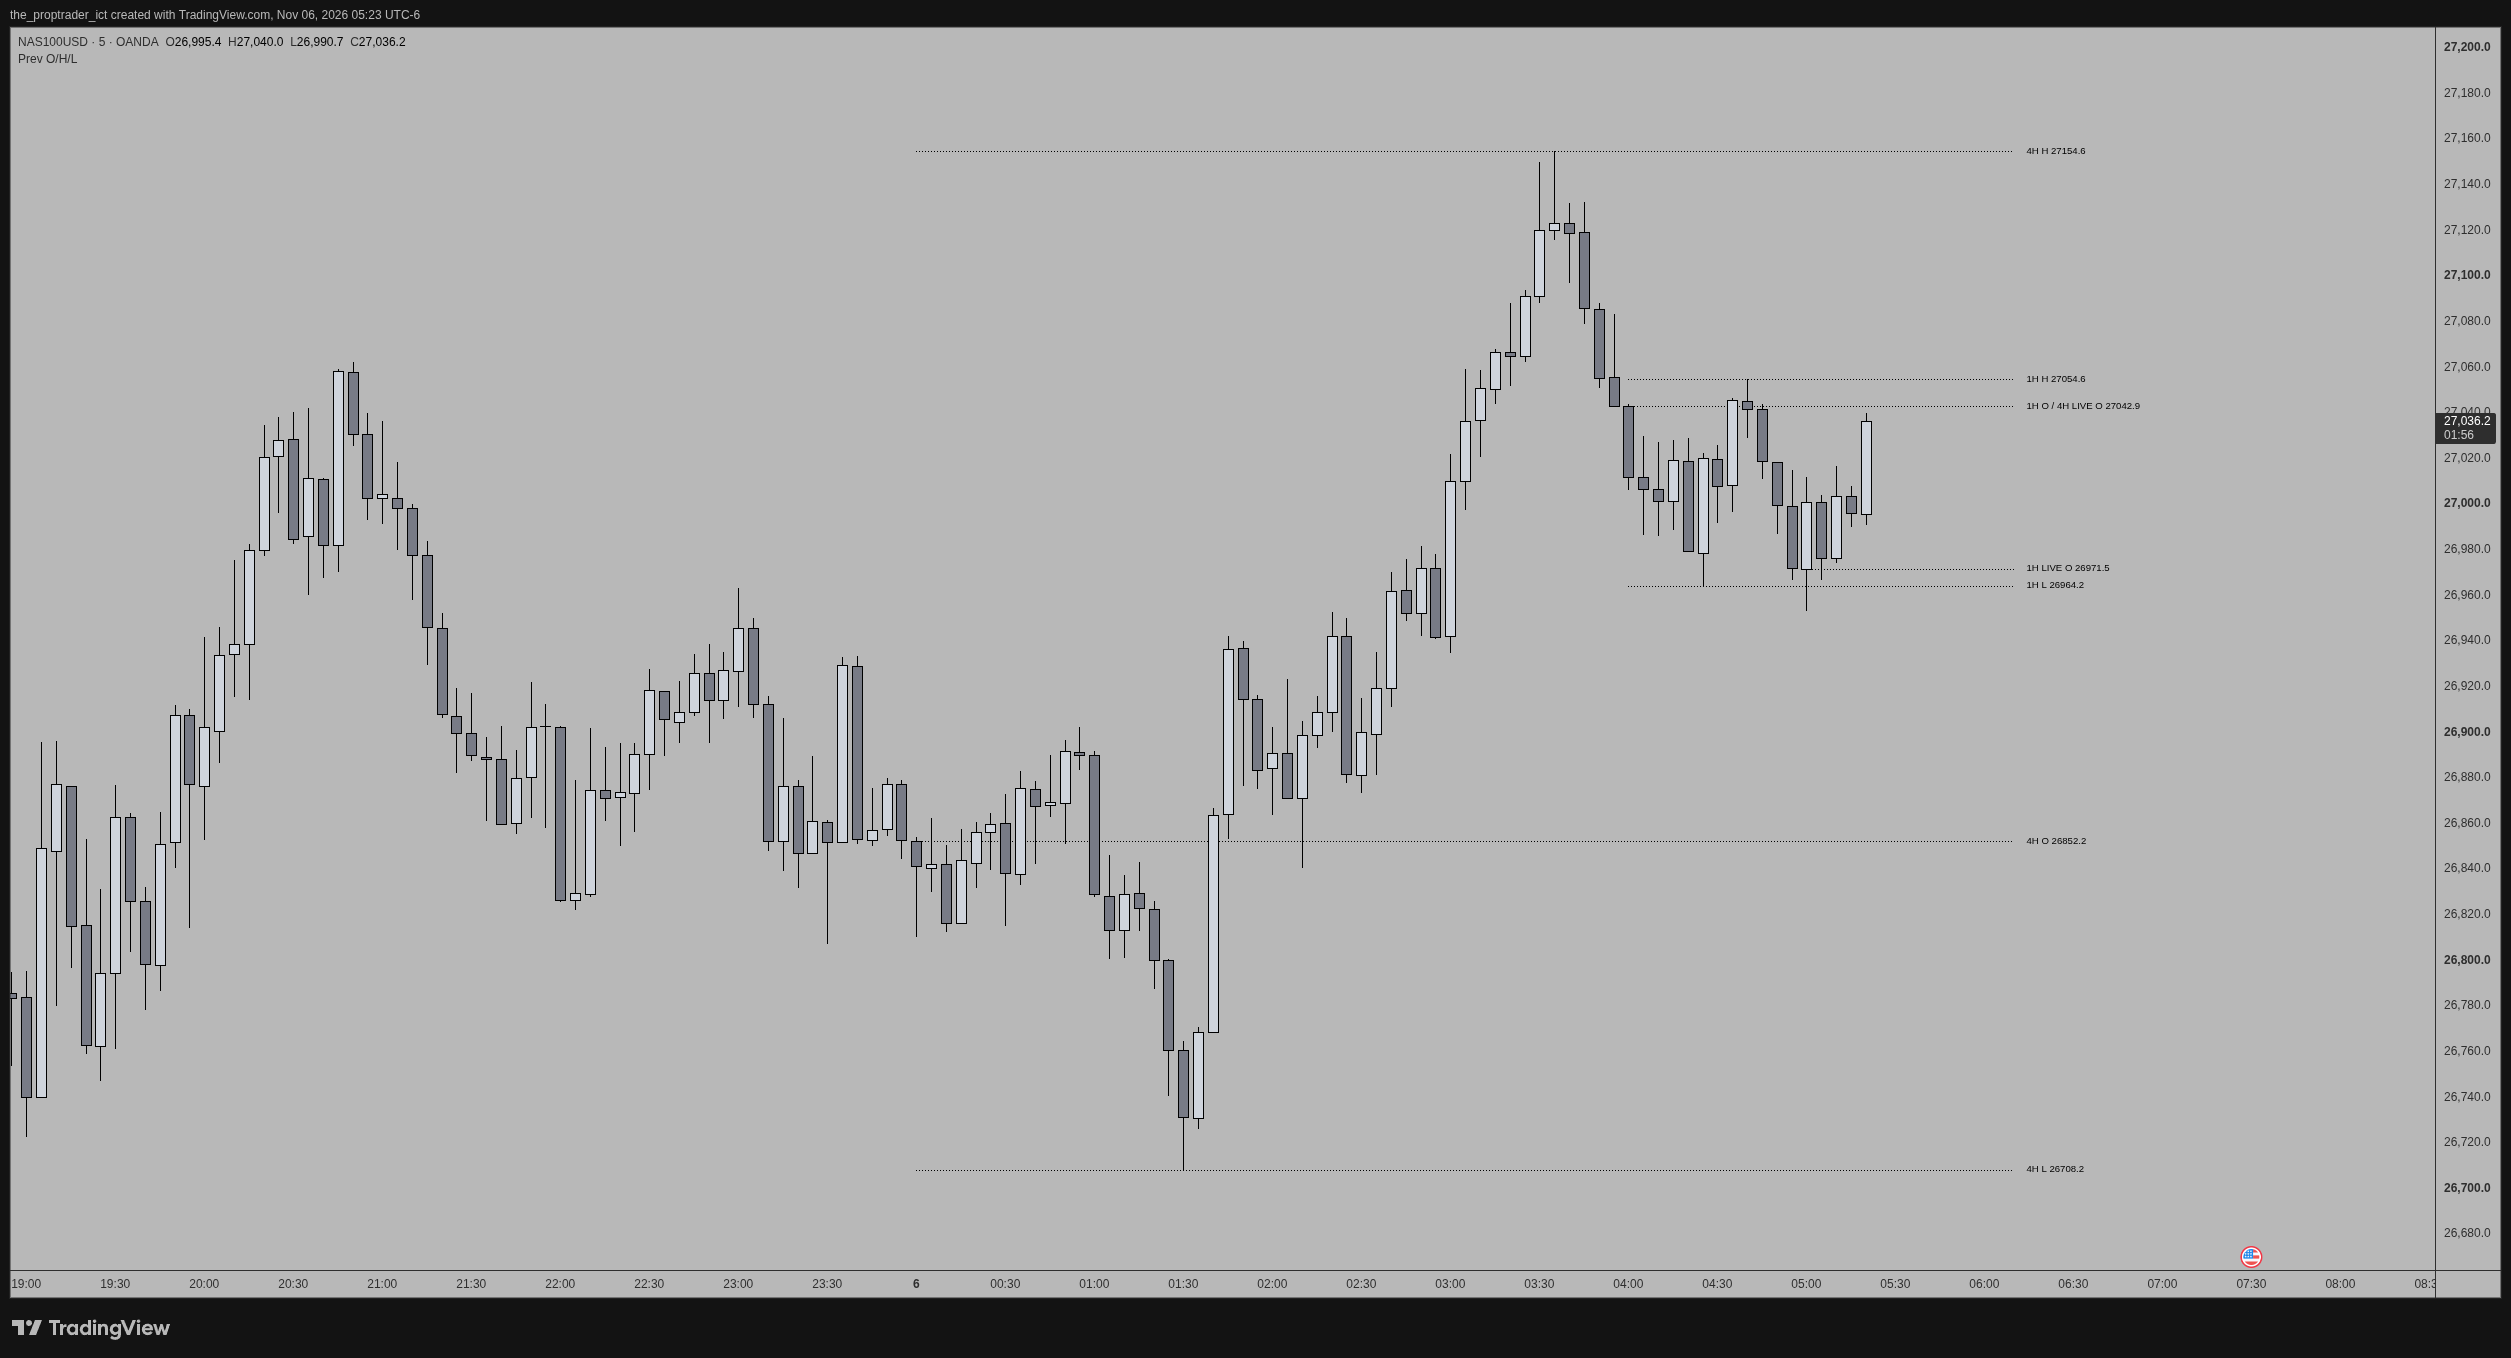
Shows the last few candles of a higher timeframe to the right of your chart, so the wider candle is in view while you work on a lower timeframe.
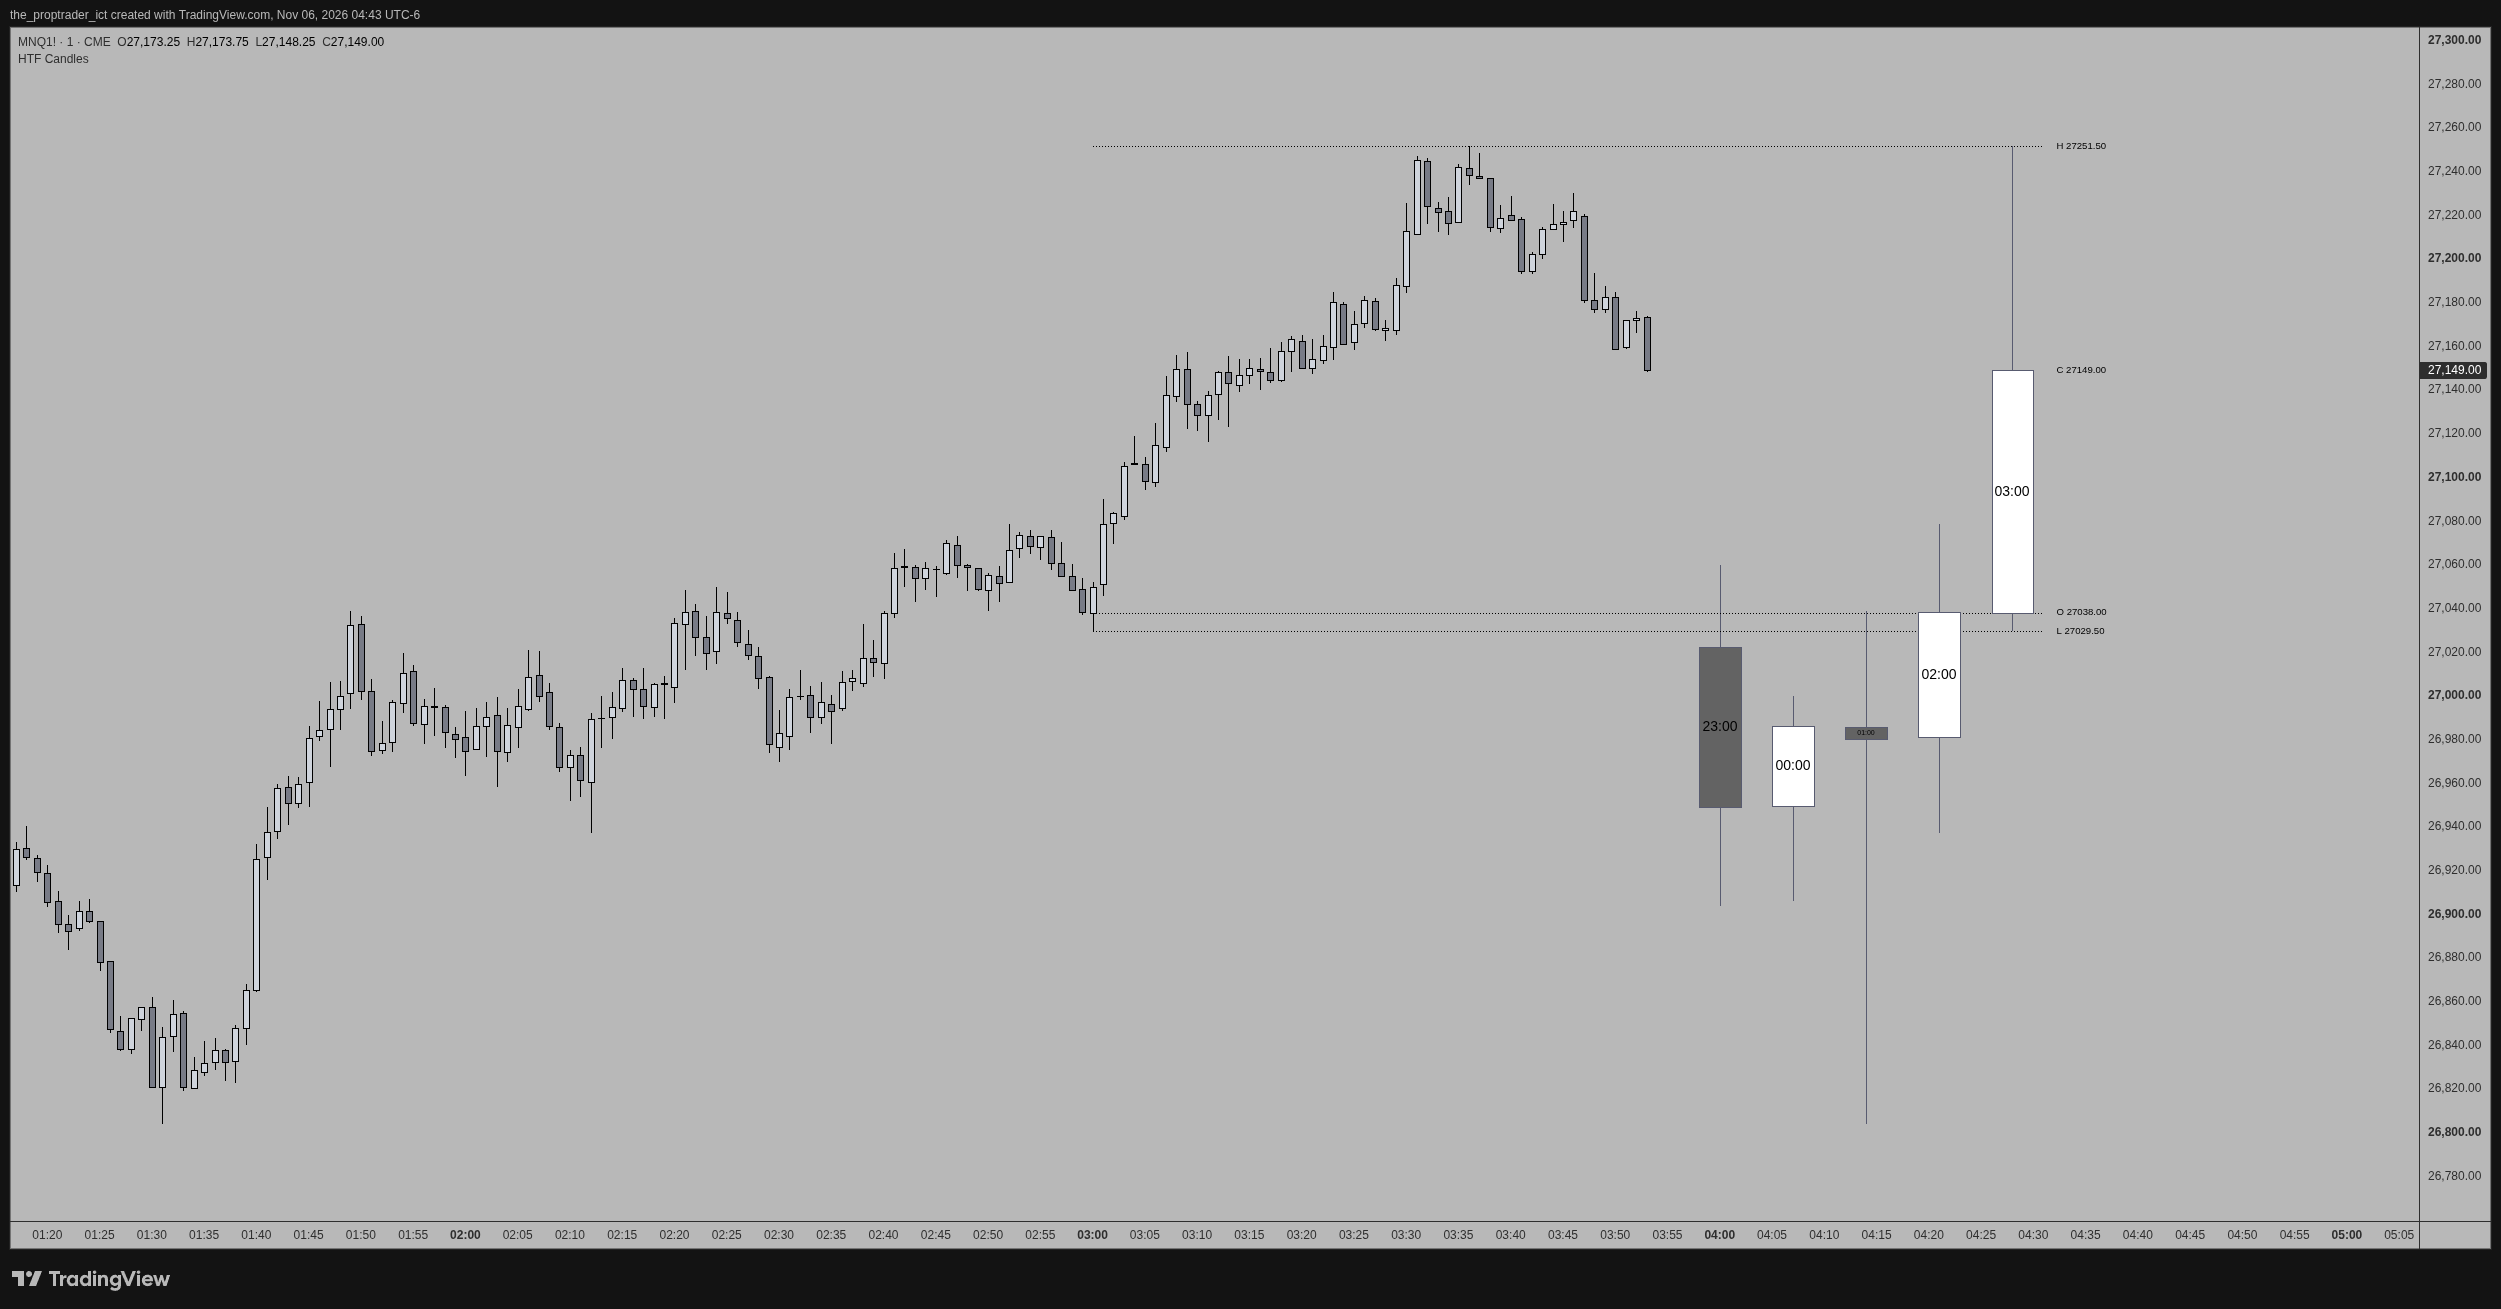
- Choose the timeframe and number of candles (default: five 1-hour candles)
- Separate up and down colors for body and wick; borders match the wick
- Dotted Open, High and Low lines for the latest candle, drawn from its real start
- Open, High, Low and Close values beside the latest candle
- Each candle’s open time inside its body (Central Time by default)
- Platform
- TradingView
- Timeframe
- Equal to or above the chart
- Copy the source or download the .pine file.
- In TradingView, open the Pine Editor and paste it in.
- Click Add to chart, then adjust the settings.
View source
//@version=6
indicator("HTF Candles", shorttitle="HTF Candles", overlay=true, max_boxes_count=500, max_lines_count=500, max_labels_count=500)

// ── Inputs ────────────────────────────────────────────────────────────────
const string G_HTF   = "HTF candles"
const string G_BULL  = "Bullish candle colors"
const string G_BEAR  = "Bearish candle colors"
const string G_OHLC  = "Latest candle OHLC"
const string G_TIME  = "Candle open time"

string htfTf         = input.timeframe("60", "Timeframe", group=G_HTF)
int    candleCount   = input.int(5, "Number of candles", minval=1, maxval=100, group=G_HTF)
int    offsetBars    = input.int(5, "Offset from last bar (bars)", minval=1, maxval=200, group=G_HTF)
int    candleWidth   = input.int(5, "Candle width (bars)", minval=1, maxval=50, group=G_HTF)
int    candleSpacing = input.int(2, "Spacing between candles (bars)", minval=0, maxval=50, group=G_HTF)
int    wickWidth     = input.int(1, "Wick width", minval=1, maxval=5, group=G_HTF)

color bullBody = input.color(#ffffff, "Body", group=G_BULL, inline="bull")
color bullWick = input.color(#585b70, "Wick / border", group=G_BULL, inline="bull")
color bearBody = input.color(#585b70, "Body", group=G_BEAR, inline="bear")
color bearWick = input.color(#585b70, "Wick / border", group=G_BEAR, inline="bear")

bool   showOhlcLines  = input.bool(true, "Show OHLC lines", group=G_OHLC)
bool   showOhlcValues = input.bool(true, "Show OHLC values", group=G_OHLC)
color  ohlcLineColor  = input.color(#000000, "Line color", group=G_OHLC, inline="ohlc")
string ohlcStyleIn    = input.string("Dotted", "Style", options=["Dotted", "Dashed", "Solid"], group=G_OHLC, inline="ohlc")
color  ohlcTextColor  = input.color(#000000, "Value text color", group=G_OHLC)
string ohlcSizeIn     = input.string("Small", "Value text size", options=["Tiny", "Small", "Normal"], group=G_OHLC)

bool   showOpenTime  = input.bool(true, "Show open time inside candles", group=G_TIME)
string timeTz        = input.string("America/Chicago", "Timezone", group=G_TIME)
color  timeTextColor = input.color(#000000, "Text color", group=G_TIME)
string timeSizeIn    = input.string("Auto", "Text size", options=["Auto", "Tiny", "Small", "Normal"], group=G_TIME)

if timeframe.in_seconds(htfTf) < timeframe.in_seconds(timeframe.period)
    runtime.error("HTF Candles: the selected timeframe must be equal to or higher than the chart timeframe.")

// TradingView rejects bar_index drawings more than 500 bars into the future.
int projectedSpan = offsetBars + candleCount * candleWidth + (candleCount - 1) * candleSpacing
if projectedSpan > 500
    runtime.error("HTF Candles: offset + candle widths + spacing exceed 500 bars. Reduce the count, width, spacing or offset.")

string ohlcStyle = switch ohlcStyleIn
    "Dashed" => line.style_dashed
    "Solid"  => line.style_solid
    => line.style_dotted

string ohlcSize = switch ohlcSizeIn
    "Tiny"   => size.tiny
    "Normal" => size.normal
    => size.small

string timeSize = switch timeSizeIn
    "Tiny"   => size.tiny
    "Small"  => size.small
    "Normal" => size.normal
    => size.auto

string timeFormat = timeframe.in_seconds(htfTf) < 86400 ? "HH:mm" : "MM-dd"

// ── HTF data ──────────────────────────────────────────────────────────────
// Runs in the HTF context: keeps a rolling window of the last n HTF candles.
// Realtime ticks roll var state back to the bar start, so the last element is
// always the developing candle.
htfHistory(int n) =>
    var array<float> os = array.new<float>()
    var array<float> hs = array.new<float>()
    var array<float> ls = array.new<float>()
    var array<float> cs = array.new<float>()
    var array<int>   ts = array.new<int>()
    os.push(open)
    hs.push(high)
    ls.push(low)
    cs.push(close)
    ts.push(time)
    while os.size() > n
        os.shift()
        hs.shift()
        ls.shift()
        cs.shift()
        ts.shift()
    [os, hs, ls, cs, ts]

// Lookahead keeps the latest HTF candle aligned with the chart bars it contains.
// Values are only drawn on the last bar, so this does not leak into history.
[hO, hH, hL, hC, hT] = request.security(syminfo.tickerid, htfTf, htfHistory(candleCount), lookahead=barmerge.lookahead_on)

// Chart bar index where the latest HTF candle starts.
int latestHtfTime = hT.size() > 0 ? hT.last() : na
var int htfStartIdx = na
if not na(latestHtfTime) and (na(htfStartIdx) or latestHtfTime != latestHtfTime[1])
    htfStartIdx := bar_index

// ── Drawing ───────────────────────────────────────────────────────────────
var array<box>   bodies     = array.new<box>()
var array<line>  wicks      = array.new<line>()
var array<line>  ohlcLines  = array.new<line>()
var array<label> ohlcLabels = array.new<label>()

if barstate.islast
    for b in bodies
        b.delete()
    for w in wicks
        w.delete()
    for l in ohlcLines
        l.delete()
    for lb in ohlcLabels
        lb.delete()
    bodies.clear()
    wicks.clear()
    ohlcLines.clear()
    ohlcLabels.clear()

    int n = hO.size()
    if n > 0
        int step      = candleWidth + candleSpacing
        int firstLeft = bar_index + offsetBars
        int lastRight = na
        for i = 0 to n - 1
            float o = hO.get(i)
            float h = hH.get(i)
            float l = hL.get(i)
            float c = hC.get(i)
            bool  bull    = c >= o
            float bodyTop = math.max(o, c)
            float bodyBot = math.min(o, c)
            int left  = firstLeft + i * step
            int right = left + candleWidth - 1
            int mid   = left + math.floor((candleWidth - 1) / 2)
            color wc  = bull ? bullWick : bearWick
            // Split wicks so they do not show through transparent or hollow bodies.
            if h > bodyTop
                wicks.push(line.new(mid, h, mid, bodyTop, xloc=xloc.bar_index, color=wc, width=wickWidth))
            if l < bodyBot
                wicks.push(line.new(mid, bodyBot, mid, l, xloc=xloc.bar_index, color=wc, width=wickWidth))
            bodies.push(box.new(left, bodyTop, right, bodyBot, xloc=xloc.bar_index,
                 border_color=wc, bgcolor=bull ? bullBody : bearBody,
                 text=showOpenTime ? str.format_time(hT.get(i), timeFormat, timeTz) : "",
                 text_color=timeTextColor, text_size=timeSize, text_halign=text.align_center, text_valign=text.align_center))
            lastRight := right

        if showOhlcLines or showOhlcValues
            // Drawings cannot reach more than ~10,000 bars into the past.
            int x1 = na(htfStartIdx) ? bar_index : math.max(htfStartIdx, bar_index - 9999)
            int x2 = lastRight + 1
            array<float>  prices = array.from(hO.last(), hH.last(), hL.last(), hC.last())
            array<string> names  = array.from("O", "H", "L", "C")
            for j = 0 to 3
                float p = prices.get(j)
                if showOhlcLines and names.get(j) != "C"
                    ohlcLines.push(line.new(x1, p, x2, p, xloc=xloc.bar_index, color=ohlcLineColor, style=ohlcStyle, width=1))
                if showOhlcValues
                    ohlcLabels.push(label.new(x2, p, names.get(j) + " " + str.tostring(p, format.mintick), xloc=xloc.bar_index,
                         style=label.style_label_left, color=color.new(color.black, 100), textcolor=ohlcTextColor, size=ohlcSize))